
Sandbox
Completed
Detect Text on Crossplots
Completed 80 weeks ago
0 team
In the previous challenge in this series, Identify and Extract Axes Values, the focus was on numerical notation. For this challenge, contestants must extract the text from these plots: title, axes labels, and axes units.
This challenge is the second in a series of retrieving data from documents. Xeek will be launching two additional challenges later in 2022. A lot of good data is trapped in old crossplots and graphs; let's release it and put it to work.
Data and Labels
The data for this challenge are images of crossplots with two axes. The crossplots have a variety of sizes, formats, noise, and orientations. The targets for extraction are the crossplots title and the axes label and units. An example of an image and the corresponding answer are shown below in Figure 1 and Table 1. Note that some images may be missing this information.
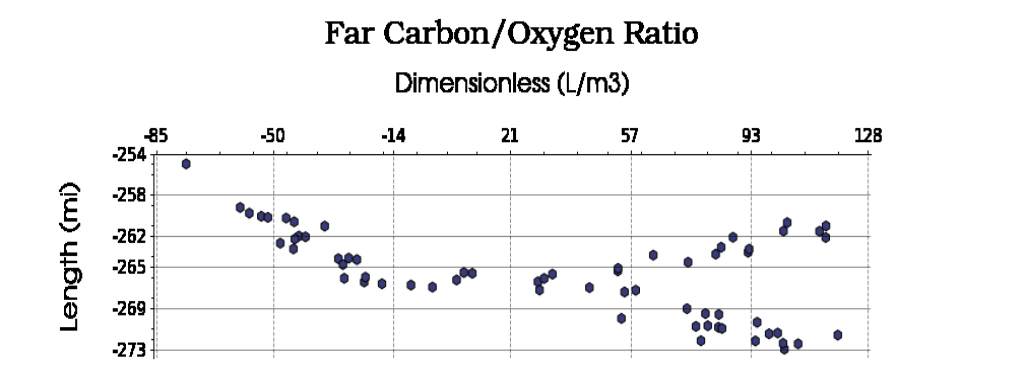
Figure 1: Example crossplot for this challenge.
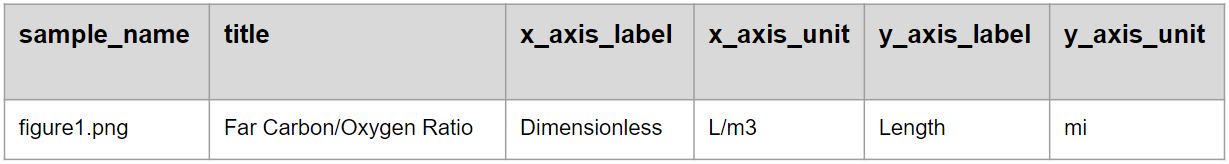
Table 1: Correct answer for the crossplot in Figure 1.
Evaluation
During the challenge, a quantitative score will be used to populate the Predictive Leaderboard. Contestants will submit a CSV as described in the Starter Notebook, containing the six target features: title, x-axis label, x-axis unit, y-axis label, and y-axis unit. Submissions will be scored against the test answer key using a Levenshtein distance. A higher score is considered more successful. Contestants can submit up to 5 CSV predictions per day.
At the end of the challenge, Xeek will request the models from the top 10 submissions for review by a panel of judges. A submission must contain a Jupyter Notebook, a requirements.txt, and any additional parameters a contestant has generated. The requirements.txt should describe the environment used to generate the model. It needs to contain the libraries and their versions, and the Python version (>=3.6 is preferred). See the Starter Notebook on the Data Tab for an example.
The judges will score the top 10 submissions on accuracy and interpretability. The accuracy of the submission counts for 90% of the final score. Accuracy will be determined using the same scoring algorithm described above for the Predictive Leaderboard. The top 20% of scores will receive maximum points (90). Other submissions will receive points based on how close they were to the top-performing submissions.
The interpretability metric counts for 10% of the final score. This qualitative metric focuses on the degree of documentation, clearly stating variables for models and using doc strings and markdown. Submissions with exceptional interpretability will receive maximum points (10). Other submissions will receive points based on the level to which they meet the criteria.