Completed
Slick in a Haystack - a Localization Challenge
$30,000
Completed 81 weeks ago
0 team
The ocean's surface is a turbulent place affected by wind, currents, tides, and human activity. One uncommon feature found across the world's oceans is oil slicks. Oil slicks can occur naturally (hydrocarbon seepage, algal blooms) and human-made (pipeline leaks, bilge water release). Knowing the location and density of these oil slicks is essential to understanding our natural systems and monitoring the effects of pollution. Unfortunately, oil slicks are challenging to spot with the unaided eye, appearing as a faint sheen on the sea's surface in the best conditions. Technology has played a significant role in monitoring these features, mainly radar satellite data collected at regular intervals over the ocean.
For this challenge, you need to identify the location of the oil slick(s) on satellite radar data from across the world. You will be provided satellite radar images with high and low-resolution versions and bounding boxes for the locations of known oil slicks. Your goal is to predict the location and size of bounding boxes on a test data set also provided to you. The difficult part of this challenge is being able to distinguish these slicks versus other look-alike features on the ocean's surface.
Background
Satellite radar data has been around for decades and collected by various private and governmental operators. The use cases for these data are many, but for this challenge, we will focus on their role in understanding the world’s oceans. The vertical resolution on radar images can be in the centimeter range, allowing oceanographers to identify numerous features: wind fields, wave distributions, sea ice, and human activity.
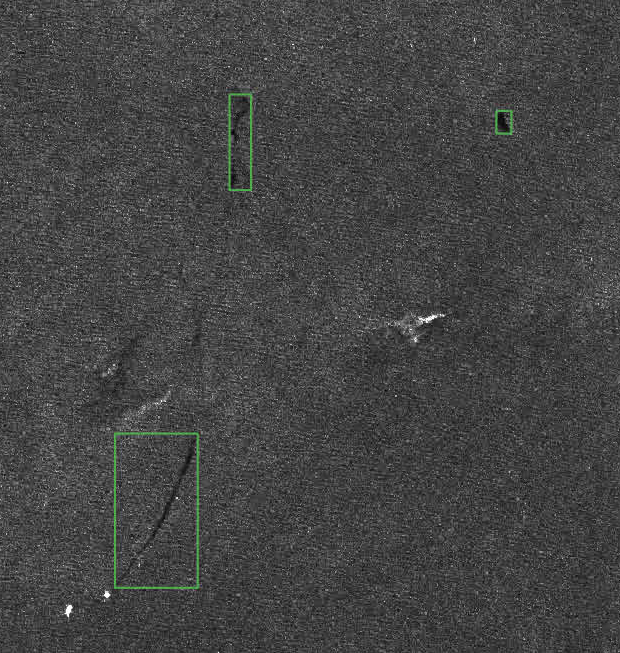
Figure 1: Example of the data for this challenge. Green boxes are the labels for this challenge and surround observed slicks on this radar image. The reason why oil slicks show up on satellite radar is beautifully simple. A level, undisturbed surface of the sea is a rare occurrence; waves and wind are always in action. When a droplet of oil floats to the ocean's surface, it changes the surface tension forces, causing a slight dampening of the amplitude and wavelength of the waves compared to its surroundings. This dampening effect is difficult to see with the human eye from a boat, but from 800 km, this slight dampening sticks out like a sore thumb. Earth scientists have known about this phenomenon for many years and have used it to catalog different features like:
Algal blooms
Seepage of naturally occurring hydrocarbons
Pipeline leaks
Bilge water from ocean vessels
Oil spills
Traditionally, the identification of oil slicks from satellite imagery was made by humans manually labeling after reviewing multiple years of radar images over one part of the ocean. If an algorithm can be developed to find these features immediately, it would help Earth scientists understand oil seepage better and enable authorities to take action sooner to limit the effects of pollution.
Data and Labels
The images for these are open source data for the European Space Agency that has had some processing steps to simplify the data for this challenge. The original file names and geographic coordinates have been removed from both the images and the labels.
Xeek is providing two sets of the radar data: high resolution and low resolution. It is at the discretion of the contestant what dataset you use. The high resolution data is very large, 1,500 GB total. We are providing the high resolution data so that contestants can understand the original data and may use that understanding to enhance their model. Note, the high-resolution data will be made available on August 10, 2022. See the Data Tab to understand how to access these data.
The labels are registered from the upper, left corner of the image. There can be more than one label per image and some labels can overlap. The labels are organized by a x max, x min, y max, y min.
One challenge with these data is false positives. There can be several features on the ocean surface that mimic the shape and texture of an oil slick. Therefore, your model will need to differentiate these different features in order to get the best score.
Evaluation
For this challenge, an upgraded version of the localization scoring algorithm is used to score both the Prediction Leaderboard and final submissions. This algorithm can be used for one bounding box per image and any number of bounding boxes. The algorithm works by finding pairs for corresponding bounding boxes with the biggest intersection over union (IOU). If a pair of bounding boxes have an IOU > 0.3 (IOU_THRESHOLD), then it is scored as a true positive (tp) prediction. If the algorithm cannot find a pair for a ground truth label (with IOU > IOU_THRESHOLD), then it is scored as a false negative (fn). All predicted bounding boxes without pairs are considered false positives (fp). And the metric score is tp / (tp + fp + fn), where tp, fp, fn, were counted through all the data. You can learn more about IOU scoring here (link). The Data Tab shows an example of a submission file for the Test Data set.
The JSON file is organized with the image's file name (i.e., 2281) and a list of bounding boxes. A bounding box is a list of four coordinates [x_min, y_min, x_max, y_max], where (x_min, y_min) is a position of the top left corner of the bounding box and (x_max, y_max) is a position of the bottom right corner of the bounding box.
Final Evaluation
At the end of the challenge, Xeek will request the models from the top 10 submissions for review by a panel of judges. A submission must contain a Jupyter Notebook, a requirements.txt, and any additional parameters a contestant has generated. The requirements.txt should describe the environment used to generate the model. It needs to contain the libraries and their versions and the Python version (>=3.6 is preferred). See the Starter Notebook on the Data Tab for an example.
The judges will score the top 10 submissions on accuracy, speed, and interpretability. The accuracy of the submission counts for 80% of the final score. Accuracy will be determined using the IoU method described above for the Predictive Leaderboard on a holdout dataset. The top 20% of scores will receive full points (80). Other submissions will receive points based on how closely they were to the top performing submissions.
The speed metric counts for 10% of the final score. This metric ensures that submissions have reasonable run times for training and inference. The standard for judging runtime will be an AWS SageMaker g5.24xlarge instance (https://aws.amazon.com/ec2/instance-types/). The fastest submissions will receive full points. Other submissions will receive points based on the level to which they meet the criteria.
The interpretability metric counts for 10% of the final score. This qualitative metric focuses on the degree of documentation, clearly stating variables for models, using doc strings and markdown, and following standard Python-style guidelines. Submissions with exceptional interpretability will receive full points. Other submissions will receive points based on the level to which they meet the criteria.
At the end of judging, final scores will be pl5aced on the Xeek challenge page. If a tie occurs, the judging panel will break the tie by evaluating the level of submission documentation.
References
Copernicus Sentinel data multiple years, processed by Xeek.